
The ETF Ledger · Data as of October 20, 2026
Every US spot single-asset crypto ETF, one table, every figure sourced.
61 funds across 17 assets, each row traced to the issuer's own fund page, fact sheet or prospectus and dated. Leveraged, inverse, futures-based, basket, active and income funds sit in a second table below, never mixed in. No verdicts here: the figures are the point. If a fund is missing, tell us and it goes in.
How to read this: what counts, where every figure comes from, and what each column means
What counts. A fund is listed if it is listed on a US exchange, holds one crypto asset directly and tracks its spot price. Converted trusts (GBTC, ETHE and the like) are included from the day they listed as ETFs. Funds that have announced liquidation are removed on their last trading day; funds registered but not yet for sale are not listed until they trade.
Where the numbers come from. Every figure comes from the issuer: the fund page, the fact sheet or the prospectus. The issuer badge on each row links to the page the figure was read from, and the As of column is the date the issuer put on it, not the date we looked. Nothing is taken from third-party trackers. Where an issuer publishes no figure, the cell is left blank rather than filled from elsewhere.
Launched is the first day of trading on the exchange, not the trust's formation or seed date, which issuers often label “inception”.
Fee is the stated expense ratio or sponsor fee. Where a waiver is in force on the as-of date, the row carries an asterisk and the terms show on hover; expired launch waivers are not noted. Fees in the second table marked † are the management or sponsor fee only, because the issuer does not publish a total.
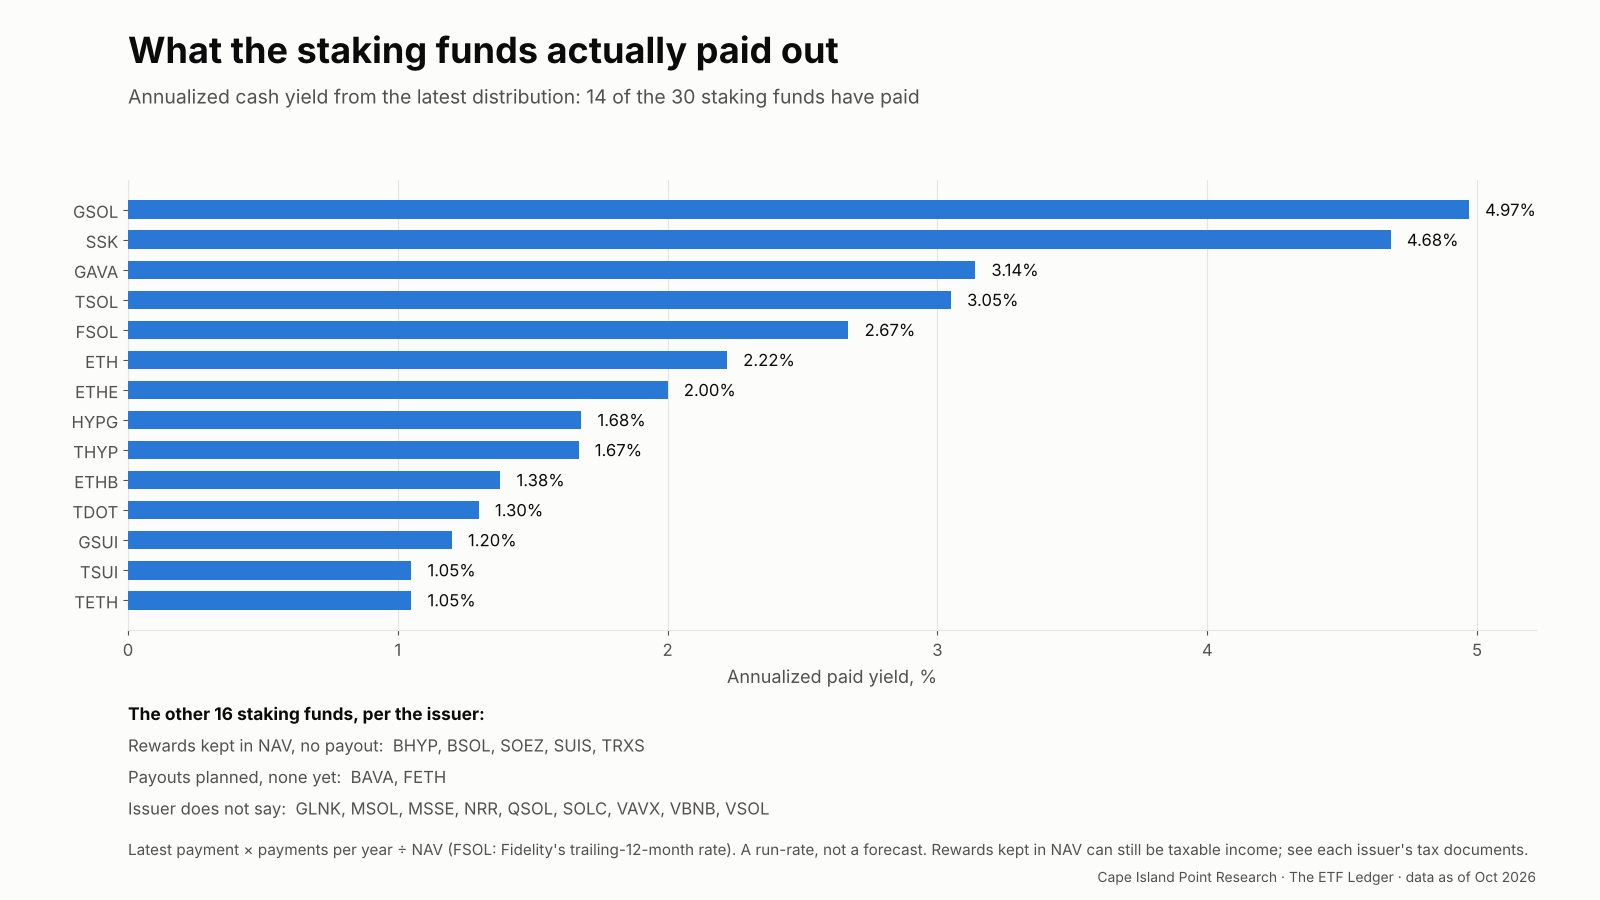
Stakes is whether the fund stakes its holdings now, per the issuer. Net staking rewards is the issuer's own reported rate, net of staking-provider costs but not of the fund fee. Paid yield is cash that has left the fund: the latest distribution × payments per year ÷ NAV, so a run-rate rather than a forecast, and it moves around for quarterly payers. Funds that keep rewards inside NAV pay nothing and show a dash. Rewards says what the issuer does with them: paid in cash, kept in NAV, planned, or not stated on the issuer's pages. Rewards kept in the fund are not necessarily untaxed: Grayscale's staking tax FAQ, for example, says it intends to report staking rewards as taxable income to shareholders whether or not they are distributed. Check the issuer's own tax documents for each fund.
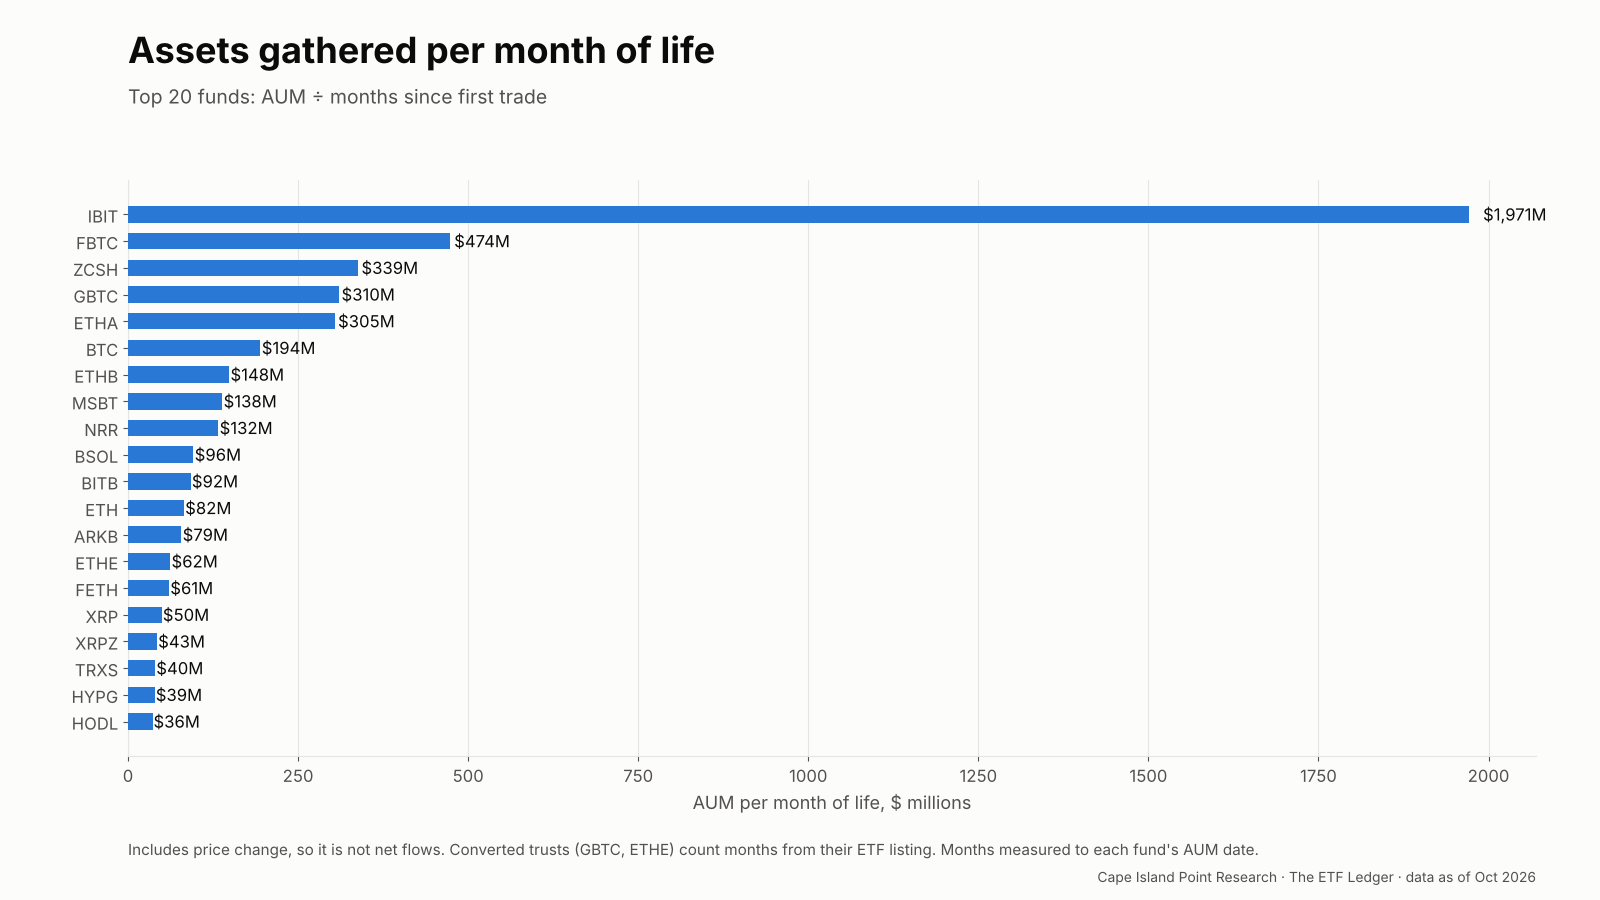
AUM / month is assets divided by months since first trade. It includes price change, so it is not net flows; it is a rough gauge of how quickly a fund has gathered assets relative to its age.
The page is refreshed monthly. Subscribers to Soundings receive the chart pack between the 5th and the 12th of the month; the public table follows within about a week. Issuers post month-end assets a few days late, so each refresh uses the latest figure every issuer has published, and the date beside every figure says which one it is. Download the spot table (CSV) · the second table (CSV).
Spot single-asset funds
Click a column heading to sort; click again to reverse. Tickers link to the issuer's fund page.
Related: What staking really costs in an Ether ETF, a fee-versus-reward-share comparison of the Ether funds above.
Three charts
Other crypto funds
39 funds kept out of the main table: leveraged, inverse, futures-based, multi-asset baskets, actively managed and options-income funds. They are not comparable to a fund that simply holds one coin, so they are never merged with it. Same sourcing rule: issuer figures only, dated. Crypto-equity ETFs and OTC trusts are out of scope.
Not listed, and why
- PSOL, PXRP (ProShares Solana ETF, XRP ETF): appear in ProShares' prospectus index marked not yet for sale. They go in when they trade.
- BWOW (Bitwise Dogecoin ETF): the issuer's page announces liquidation on October 22, 2026, with October 14 the last day to sell; remaining shares are redeemed at the October 21 NAV. Removed from the spot table.
- BTF (Valkyrie/CoinShares Bitcoin and Ether Strategy): issuer set its last trading day for October 20, 2026. AETH (Bitwise Ethereum Strategy): liquidated October 13, 2026.
- Crypto-equity ETFs (miners, exchanges, “blockchain” baskets) and OTC-quoted trusts that are not exchange-listed are out of scope.
Corrections
If a figure here disagrees with the issuer's page on the date shown, the issuer is right and we want to know: crypto@capeislandpoint.com. Corrections are made on the page and noted here, with the old and new figure.